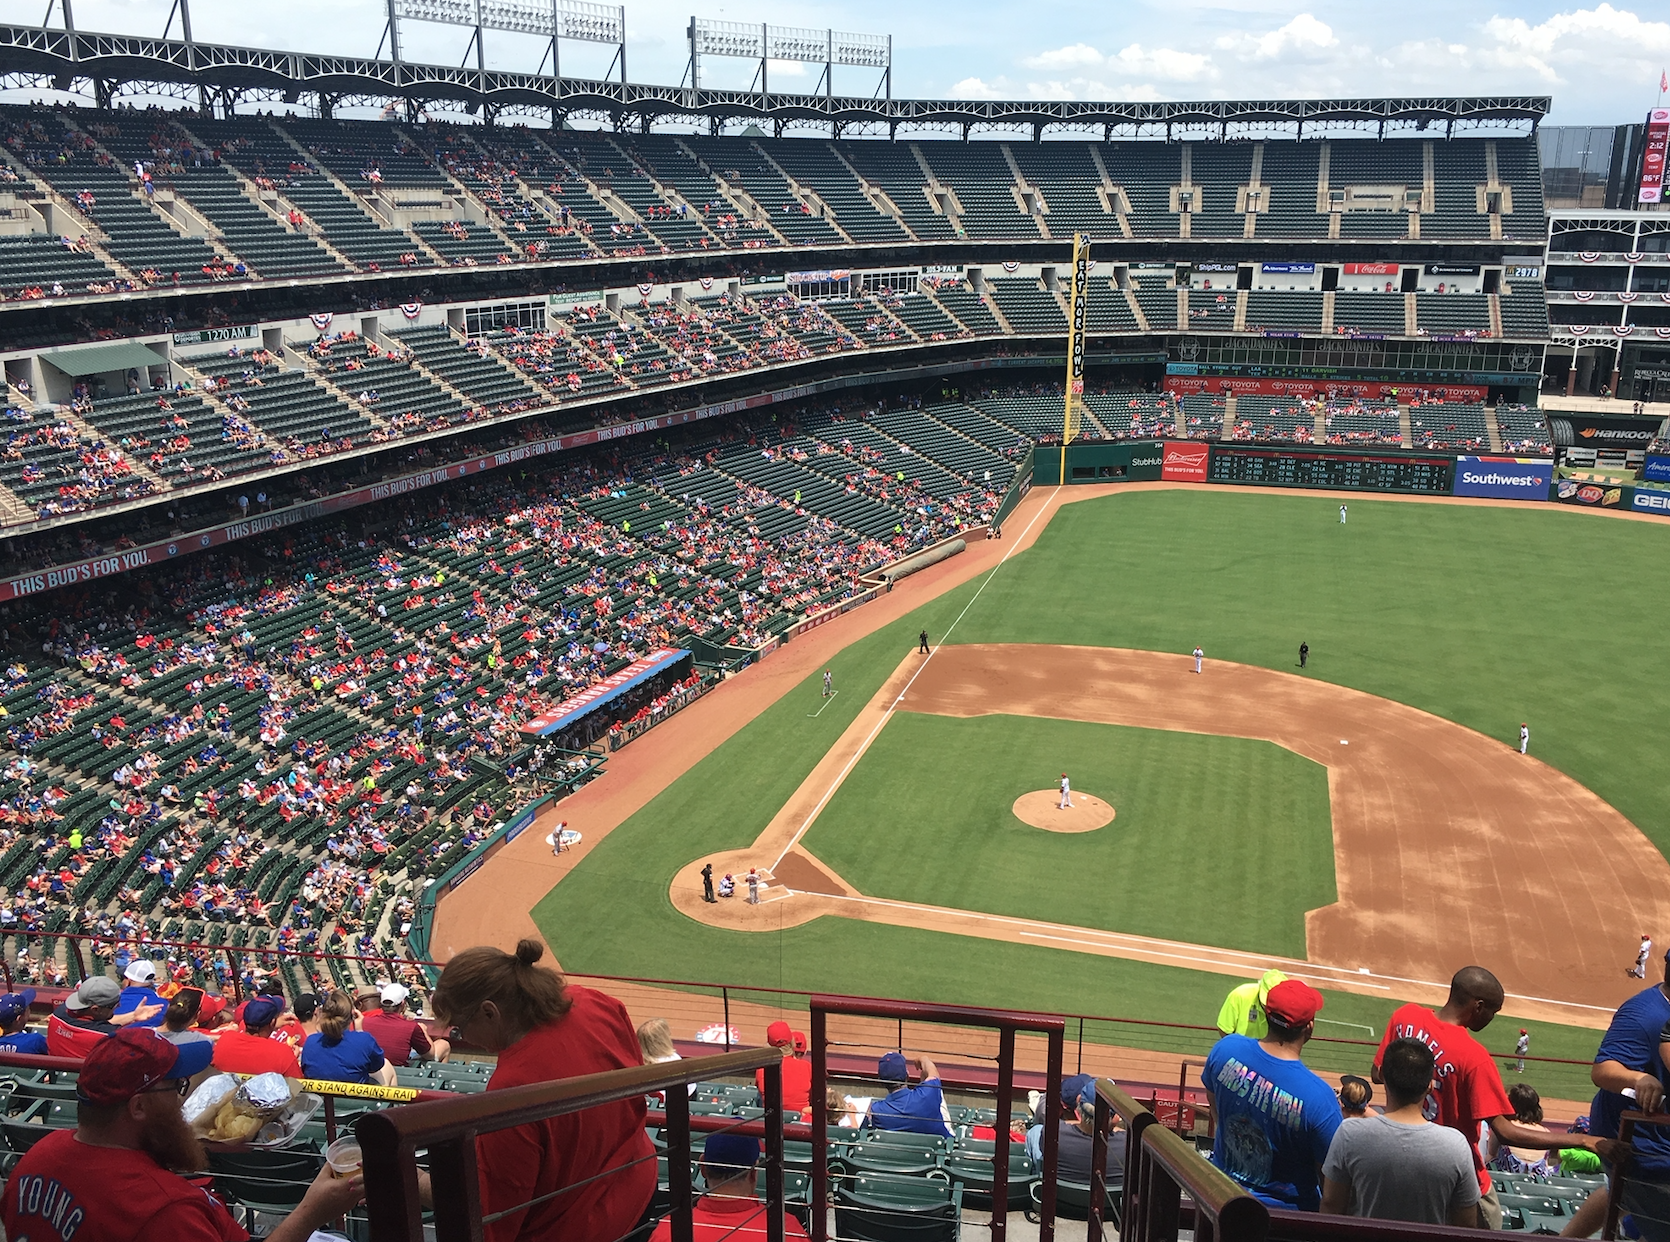
Every year, Team Marketing Report tracks thing that are important to fans, like the average cost of sports tickets and the average cost for a family of four to attend a game. Team Marketing Report was first published in 1988 as the “only publication devoted to reporting innovative and successful ideas to increase revenues for sports teams.”
The average cost to attend a Major League Baseball game rose slightly in 2018, by 2.7 percent. They track two tiers of tickets, non-premium tickets and premium tickets. The cheap seats and the good seats.
For a non-premium ticket, fans across baseball shelled out an average of $32.44 last season, and $114.50 for a premium seat. The Rangers were considerably under each average: $26.94 for a non-premium ticket, and $66.50 for a premium ticket.
The average cost of a beer is $5.98 throughout baseball, $6.00 throughout the Ballpark. An average hot dog comes in at $5.01 on average, $6.00 at the Ballpark. Parking averages $15.42 everywhere else, and $17.00 in Arlington.
They also track another pretty important stat. They call it the Fan Cost Index® (you know it’s important because they stuck a ® next to it). It’s what it costs, on average, for a family of four to attend a game, including four non-premium tickets, parking, four hot dogs, four sodas, two beers and two souvenir caps.
The Major League average $230.64. At the Ballpark, it’s $217.76.
So, with a bit of math one can figure out a few things you may have wondered. Like, how much revenue is generated by actually having an actual fan in a seat at the Ballpark instead of simply a ticket sold (the difference between announced attendance versus actual attendance). When you’re in a stadium and they announce the attendance and you look around and say to yourself, there’s no way that many people are here. What is lost when fans buy a ticket but decide it’s not worth their time to show up?
Take the $217.76 (the cost for four to attend a game), and subtract the cost for four tickets ($26.94 x 4 = $107.76) and you get $110. Divide that by four and it’s $27.50. So, for every fan actually in the Ballpark the team generates an average of $27.50 in revenue. Conversely, for every fan that pays for a ticket and doesn’t show up, the team loses out on $27.50. That’s why when attendance is dreadful in the middle of August and September, teams like the Rangers will offer steep discounts on seats. It’s not the ticket revenue they are after, it’s the $27.50.
So, it’s one thing to have a dip in average yearly attendance. Those numbers reflect ticket sales decreases. It’s even a bigger revenue loss when you add in the no-shows at $27.50 a pop. Major League Baseball doesn’t release that data.
But what is losing costing the Rangers in terms of lost attendance? In 2012, at the height of the Rangers on-field success, after two straight trips to the World Series, Texas drew 3,462,780 fans, an average of 42,719. Last season, in 2018, those numbers plummeted to 2,107,107 overall and 26,013 per game. And those numbers are tickets sold.
By letting the team hit rock bottom, the Rangers have lost 1,355,073 yearly fans in seven years. (Usually the effect of a good season or a bad one is felt the following year. So, it stands to reason that attendance this year will be even lower than last season.)
Even assuming every one of those tickets sold was actually a fan in the seat, here’s what that loss of fan base between 2012 and 2018 has meant in loss of attendance, roughly of course, using the number from Team Marketing Report. If four fans are paying an average of $271.76, divide that by four and you get $54.44, the average cost for one fan (ticket included). Multiply that by the 1,355,073 dip in attendance you get a loss of $73,770,174 in potential revenue.
Of course, an accountant would have a field day shooting holes in the accuracy and validity of these numbers but it does shed some light on what the Rangers are losing in revenue by not fielding a team fans want to flock out to see.
Seems the cost of losing is just as significant as the cost of winning.
